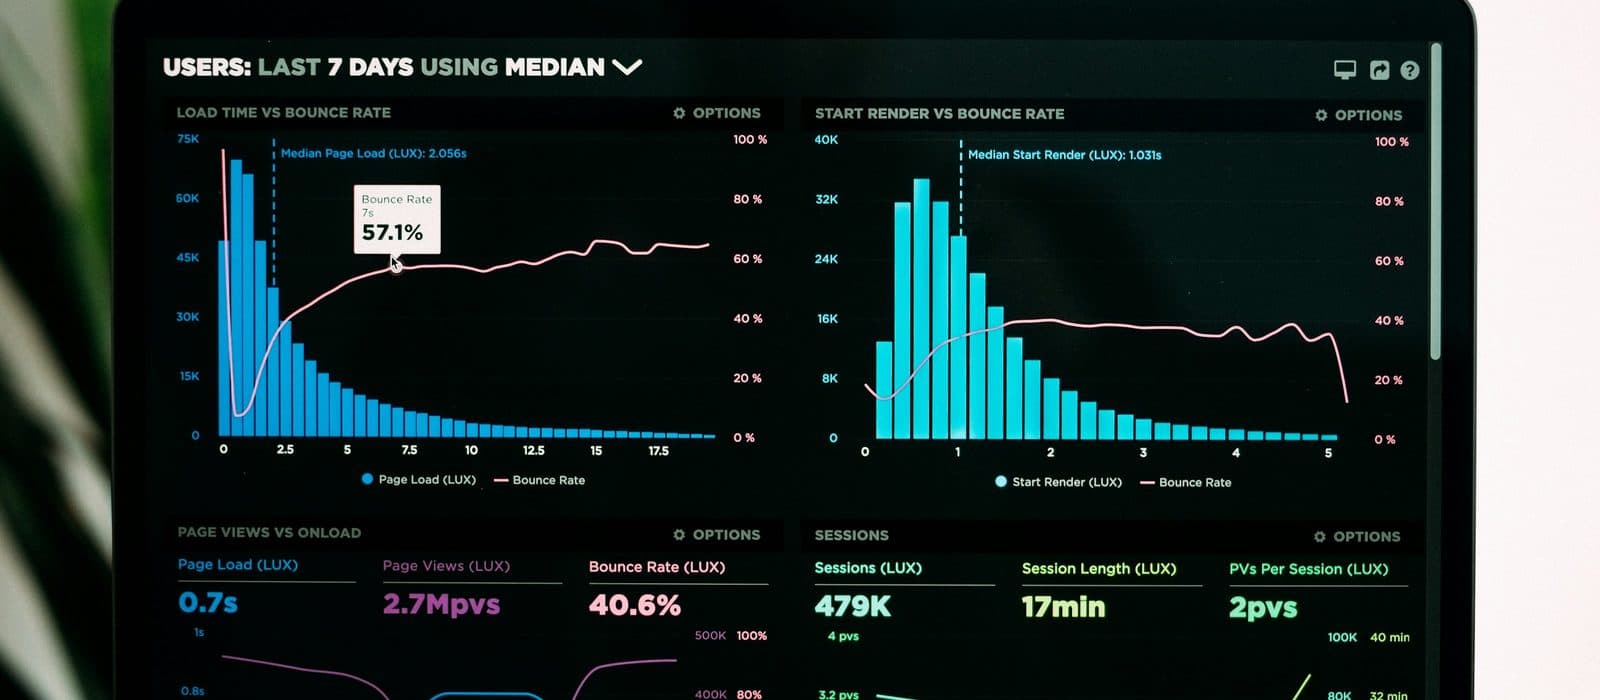
Most campaign dashboards are built to impress the room: big totals, green arrows, a map. None of it tells the finance lead what to do in the next hour – and the closing stretch is decided in hours.
We strip the dashboard to four numbers: dollars in the door today against target, recurring opt-in rate, cost per dollar raised by channel, and the burn-down to the deadline. Everything else is a drill-down, not a headline.
"A dashboard isn't a trophy case. It's a decision surface – if a number doesn't change what you do next, it doesn't belong above the fold."
The test we apply is simple: at 11pm on the last night of the quarter, can the finance lead look at one screen and know whether to send the extra email? If the answer is anything but yes, the dashboard isn't done.